Plasma Dynamics of Electric Discharges Sustained in Bubbles in Water: Images and Optical Spectra
1. Introduction
Electric discharges in bubbles in water are being investigated due to their ability to produce chemically reactive species such as hydrogen peroxide, hydroxyl and oxygen radicals for applications ranging from environmental cleanup to chemical processing. Due to the large dielectric constant of water (εr ≈ 80) compared to atmospheric pressure gas, pulsed plasmas sustained in bubbles tend to propagate along the gas-water interface. These plasma dynamics concentrate the plasma power at the location where the water vapor density is highest and so the production of oxidizing radicals is largest. In this project, we are conducting a computational investigation of the plasma dynamics of electrical discharges in bubbles in water with the goal of quantifying the basic processes and potential applications of these systems. Synthesized images and optical spectra from the bubbles are compared to recent experiments by Tachibana et al.[1]
2. Description of the Model and Conditions
The model used in this investigation is nonPDPSIM, a 2-dimensional plasma hydrodynamics model in which Poisson's equation and transport equations are solved for densities and momenta of charged and neutral particles, and for radiation transport. In Tachibana's experiments, atmospheric pressure bubbles of selected gases were released into water at the tip of an electrode followed by application of high voltage to create the discharge a few ms later. Water vapor is therefore not likely to be uniformly saturating the gas. To address these conditions, water vapor is allowed to diffuse into the bubble from the water-boundary where its density is given by the saturated water vapor.
3. Basic Properties
The model geometry is shown in Fig. 1(a) and is cylindrically symmetric across the center line on the left boundary. The discharge is initiated and sustained inside the bubble with a diameter of 3 mm. Charges are allowed to accumulate at the bubble-surface consistent with the incident plasma fluxes. Secondary electron emission is also taken into account when ions strike on the surface of the water. Outside the bubble is water, which in our model is treated as a dielectric material with dielectric constant ε/ε0 of 80 and conductivity of 10-5 Ω-1 cm-1. Below the bubble is the powered electrode, applied with up to 30 kV. A grounded electrode is placed on the top and right boundaries. The discharge evolution is shown by the electron density in Fig. 1(b).
a)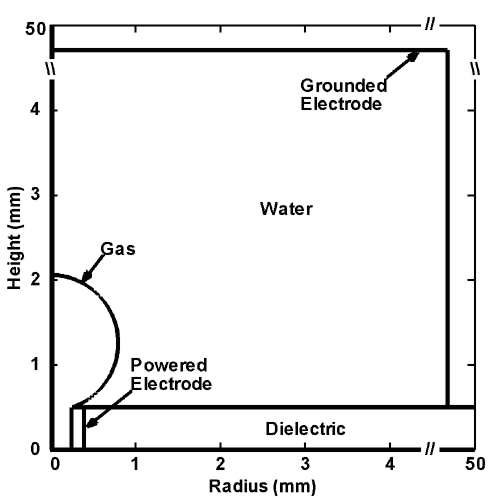
|
b)
|
Figure 1. Discharges in bubble in water. (a) Schematic of the computational domain and (b) the evolution of the discharges in 10 ns with 15 kV pulse for He, Ar and N2 bubbles. |
|
4. Optical Images of Total Emission and Hα Emission
Discharges in water were simulated for He, Ar and N2 bubbles. Comparisons of results from the model to experiments are shown in Fig. 2. All these discharges in general have similar appearance and are similar in structure. In the case of total optical emission, shown in Fig. 2(a) for N2 bubbles, the discharge is strongly confined to the gas-water interface, while the discharge penetrates the volume of the bubble when sustained in He or Ar. The Hα emission (656.3 nm) intensities are shown in Fig. 2(b). Obvious differences are in the discharge thickness and the emission intensity. For He discharges the Hα emission is thicker, while the Hα emission is confined along the interface for Ar or N2 bubbles. The emission is most intense in the He discharge and least in the N2 discharge, indicating higher and lower density of excited species, respectively.
a)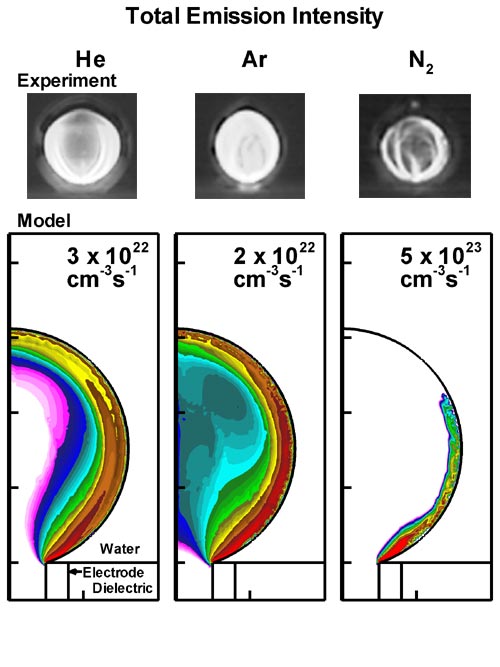
|
b)
|
Figure 2. Images of optical emission, (a) total emission and (b) Hα emission, from discharges sustained in bubbles of He, Ar and N2 immersed in water. (Top row) Images from the experiments by Tachibana et al. [1] (Bottom row) Contours of emission intensity (cm-3s-1) predicted by the model (3 decade log scale). Maximum values are shown in each frame. |
|
5. Relative Emission Intensity
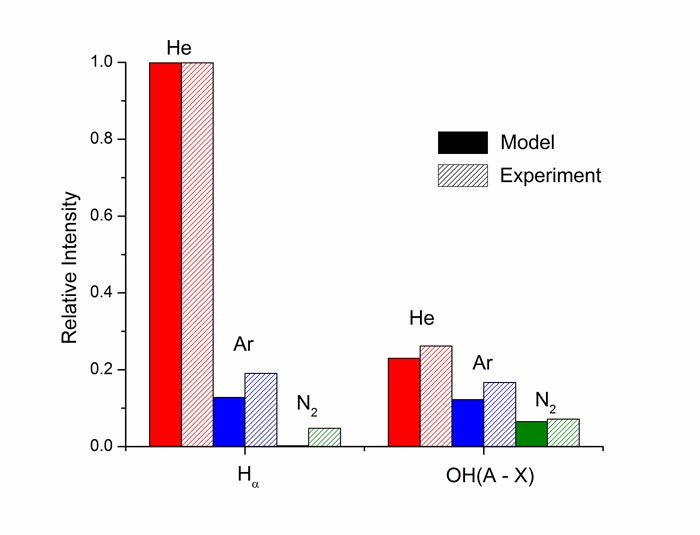
The relative volume-average intensities of optical emission from excited hydrogen atoms, Hα (656.3 nm) and emission from OH(A) (306.4 nm) are shown in Fig. 3. The Hα line is more intense in He discharges than in Ar discharges, in part due to excitation transfer from excited states of He atoms to H2O, which dissociates the water and produces H*. Excited states of Ar are not energetic enough to produce such emission. Excited states of He and Ar can excitation transfer to H2O to produce OH*, and so the emission intensities are more nearly equal. In N2 bubbles, the electron temperature is lower so that the excitation of H atoms is less intense. Since the discharge occurs dominantly along the interface, the volume-average emission is also weaker.
|
Figure 3. Relative intensities of Hα (656.3 nm) and OH(A) (306.4 nm) emission from discharges sustained in bubbles of He, Ar and N2 in water. Predictions from the model (solid) are compared to experiments (hashed). [1] |
References
- K. Tachibana, Y. Takekata, Y. Mizumoto, H. Motomura and M. Jinno, "Analysis of a Pulsed Discharge Within Single Bubbles in Water under Synchronized Conditions", Plasma Sources Sci. Technol. 20, 034005 (2011).